
Introduction
Business intelligence in manufacturing applications helps monitor and analyze manufacturing processes and make decisions. It can be used to analyze large data sets, making it easy to understand the outcome. It can be also used to schedule maintenance, thus reducing the times that operations will be down. The application of graphical tools such as graphs, charts, and dashboards enables the stakeholders to comprehend the information at their disposal and improve manufacturing activities. Learn to create an effective manufacturing dashboard to optimise your production data management.
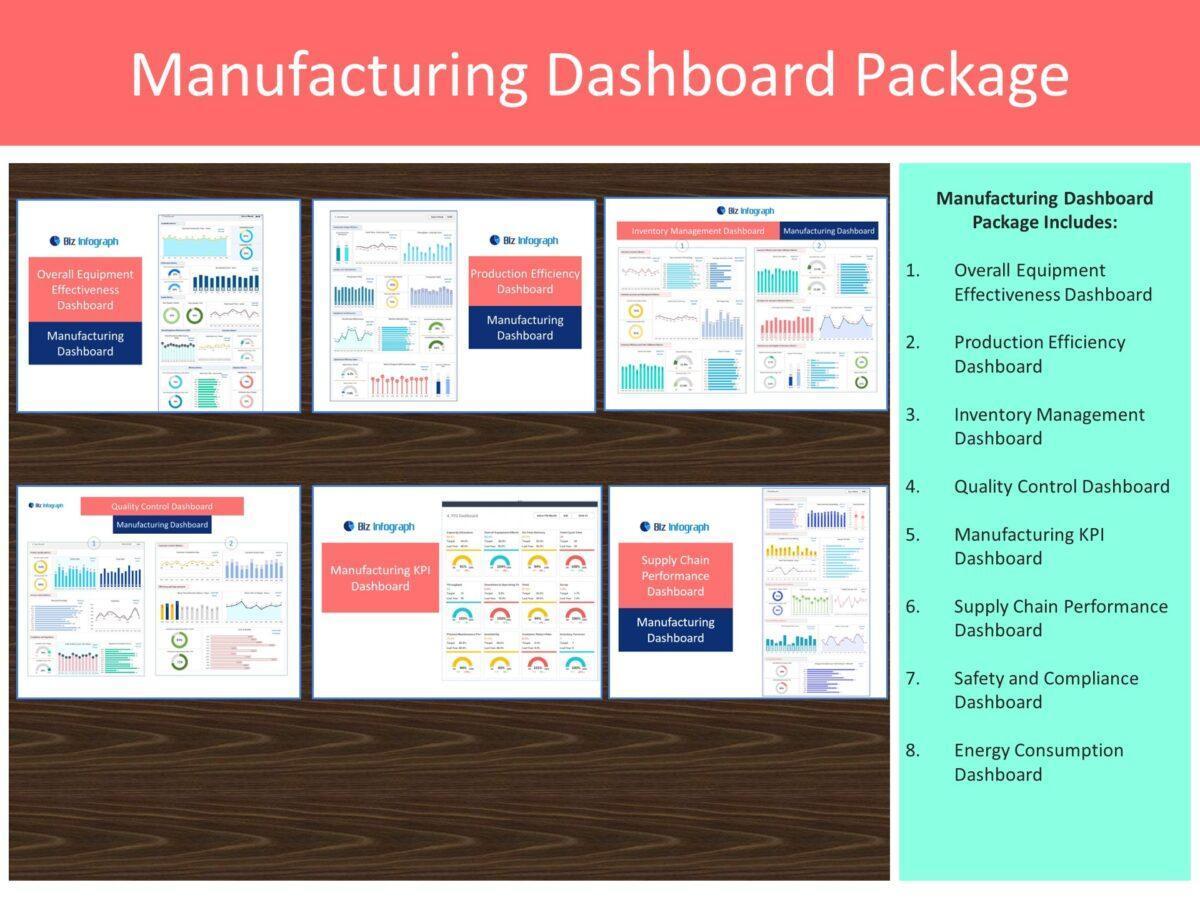
Manufacturing dashboards provide actual data in a clear and understandable format to the management with simultaneous information processing. Evaluating indicators, like the amount of production, machine productivity, or inventory amounts, becomes easy due to features like customizable widgets and interactive charts. Such representations facilitate trend analysis and exceptional occurrences that decision-makers can recognize.
Defining the purpose of Your Manufacturing Dashboard
Identifying Key Stakeholders
Managers in charge of plants demand information for execution and tactical planning and, in general, productivity enhancement. Specifically, the quality assurance personnel, who may be professionals in quality control, depend on data to guarantee that the products produced meet the recommended qualities. Floor supervisors require real-time operational data to undertake their responsibilities and to solve a challenge that may arise due to the operations. Each stakeholder’s needs point out the significance of appropriate, timely data presentation in the form of visualizations that would fit into their responsibilities to facilitate decision-making and operational control in manufacturing contexts.
Setting clear objectives
A manufacturing dashboard aims to:
1. Optimise the productivity rate for this process by measuring throughput time and other losses.
2. Minimize waste by measuring material consumption and yield percentages.
3. Improve quality assurance by using charts to show the degree of defects and compliance statistics.
4. Ensure efficient use of resources through tracking of hours machines are used, as well as employee efficiency.
Essential Metrics to Include
Production Volume
Production volume tracking involves measuring the total production of goods or services in a certain period. It enables one to understand how production goals are to be met, how resources are to be deployed, and how operations efficiency is to be evaluated. Overproduction’s awareness fully shields strategic direction, demand forecasting, and decision-making for its fitting in business targets and manufacturing operations’ profitability objectives.
Machine utilisation rates
Measuring the efficiency of machinery and equipment includes noting the time the individual machinery spends in operation or idle, the time spent on the production of one batch of a product, and the schedule of its maintenance. This provides proper allocation, points out tendencies to emerge issues with low-efficient equipment usage, and helps prevent them by timely maintenance. Therefore, by evaluating these measurements, everyone can have CI programs, improve production performance, and optimize the return on investment in manufacturing facilities.
Quality metrics
Measures like defects per million, returns, and adherence to standards are important in maintaining quality in manufacturing production. They provide direction on how products are produced, the level of customer satisfaction, and conformity to the set legal requirements. Such indicators allow for the proper monitoring of quality and productivity and help to improve processes and avoid the release of low-quality goods and services, thus increasing the efficiency of the company’s operations.
Downtime and maintenance tracking
Understanding of downtime causes is based on categorizing them as, e.g., machine breakdowns, time for preparing equipment, or time needed for maintenance. The planning of the schedules for the preventive maintenance in relation to this analysis assists in preventing the likelihood of manufacturing a hopeful interruption of productivity, the reliability of equipment, and manufacturing arising in manufacturing processes, which is improved for better usage of the available resources.
Choosing the right Data Visualization Tools
Real-Time Monitoring Displays
Real-time data is very valuable on the production floor as quick decisions must be made regarding production difficulties, machine breakdowns, or quality variations. It can allow supervisors to make adjustments in terms of schedule, resources, and process in case they note that the flow of activities is being hampered, enabling efficiency in the manufacturing environments.
Historical data analysis
The analysis of trends in manufacturing historical data helps in creating better and more realistic strategies for the future because it shows the periods of growth, stable and fluctuating periods, or any other performance trends. It helps design operating capacities, inventory, and resources, which prepares it for future market changes and operational issues as efficiently and effectively as possible, leading to better business efficiency and profit margins in the long run.
Data Integration and Automation
Integrating Diverse Data Sources
Data consolidation of ERP systems, data collectors of production lines, and quality control information is a blend of APIs, middleware, or a Data Integration platform. This means that work needs to be done on the different data formats, and duplications across systems must end. There are some advantages to using data warehouses or storing the data in the cloud; it allows for better integration, so the data can be stored and analyzed together, giving a company a complete picture for decision-making in manufacturing.
Automation of data collection
Automated systems entail the use of Internet of Things devices, sensors, and information-gathering technologies linked to dashboard software. These systems provide for concurrent data collection from the used equipment, product assemblies, and quality assurance procedures. There is increased efficiency in updating, accuracy, and availability of pertinent operational information to support management decision-making in manufacturing from the data fed into the dashboard.
Customization and User Accessibility
Tailoring dashboards to user needs
Specialization of interfaces means that we need to make necessary changes to the layout of the presented data, visualization, and access permissions in accordance with the manufacturing context and performer’s position. Line managers might be interested in the plant’s overall productivity rates, while quality assurance specialists need the numbers on defects and compliance. It improves user effectiveness, unambiguity, and richness of the information for decision-making and operations management.
Mobile and remote access
Ideally, dashboard functionality should be available not just on laptops/PCs but also on mobiles too. This way, the data can be retrieved and analyzed through smartphones and tablets, thus making it easier to make timely decisions. This increases adaptability and proactivity in interacting with processes governing the production, as well as providing up-to-date and timely information to stakeholders, no matter where they are or what sort of device they are using.
Security Measures
Protecting Sensitive Data
To enhance the security of information in the dashboard, data encryption methods, including data transfers and storage, need to be incorporated. The levels of authorization of the users granted access to the dashboard should be determined, and controlled access to the logs should be done frequently. Some of the recommended protective measures that can effectively guard manufacturer-sensitive data against people with wrong intentions include several methods of authentication as well as an updated software system.
Compliance with Industry Standards
To make certain that the Biz Infograph dashboard complies with the requirements of a specific industry, it is necessary to follow laws like GDPR, HIPAA, or ISO 27001. Use encryption of the data, personal data anonymization, and proper methods of data storage. Carry out periodic assessments and audits to ensure that the company’s operations meet the legally required standards. Other measures that are important in preventing illegitimate use of data include sensitization of people in the manufacturing industries on ways to handle the data, as well as developing policies on how different personnel can access the data and how this data can be archived.
Evaluating and improving dashboard effectiveness
Metrics for Success
Ensure that anyone in the organization using the dashboard understands the meaning of success regarding the data displayed on the dashboard with reference to the business goals, for example, reducing the time taken to complete a function or overall enhancing the quality produced. Evaluate achievements with such criteria as production results enhancement, cost and price decrease, or mistake minimization. Periodically analyze the feedback from the users, the usage level, and the contributions of the dashboard to operational decisions to identify discrepancies and areas for enhancement.
Continuous improvement
Methods such as creating a feedback survey or focus group should be used to get feedback from the users to update the dashboard. The key step here is to categorize improvement activities according to the demands of the users and shifting commercial needs. Carry out the analysis of KPIs and other performance indicators on a regular basis to identify changes in alignment with the organizational objectives. Use of Mitigating strategies such as the application of the agile development methodologies that would assist in refining the development of the dashboard by incorporating frequent feedback from real users.
Conclusion
A well-implemented manufacturing dashboard can turn around the operation by giving tangible values of the current status of production data, quality control, and usage of resources. It also improves decision-making since management can predict how the firm will operate in different situations, prevent downtimes, and raise efficiency levels. These factors make it necessary for the elements of the dashboard to be regularly improved and updated to capture new business requirements and technological enhancements. In this way, through the inclusion of user feedback and the use of new data sources, organizations can bring their performance to the next level, ensuring higher productivity and competitiveness within the market.